Machete-mode Debugging
Created 1 May 2016
This presentation explains an approach to debugging thorny Python problems, using Python’s dynamic nature to extract information in unusual ways.
I gave it at PyCon 2016 in Portland. You can read the slides and text on this page, or watch the video, or open the actual presentation in your browser (use right and left arrows to advance the slides).
Python is a great language. We love it for its flexibility and dynamism. With discipline, we use Python in ways similar to stricter languages, and build large systems successfully.
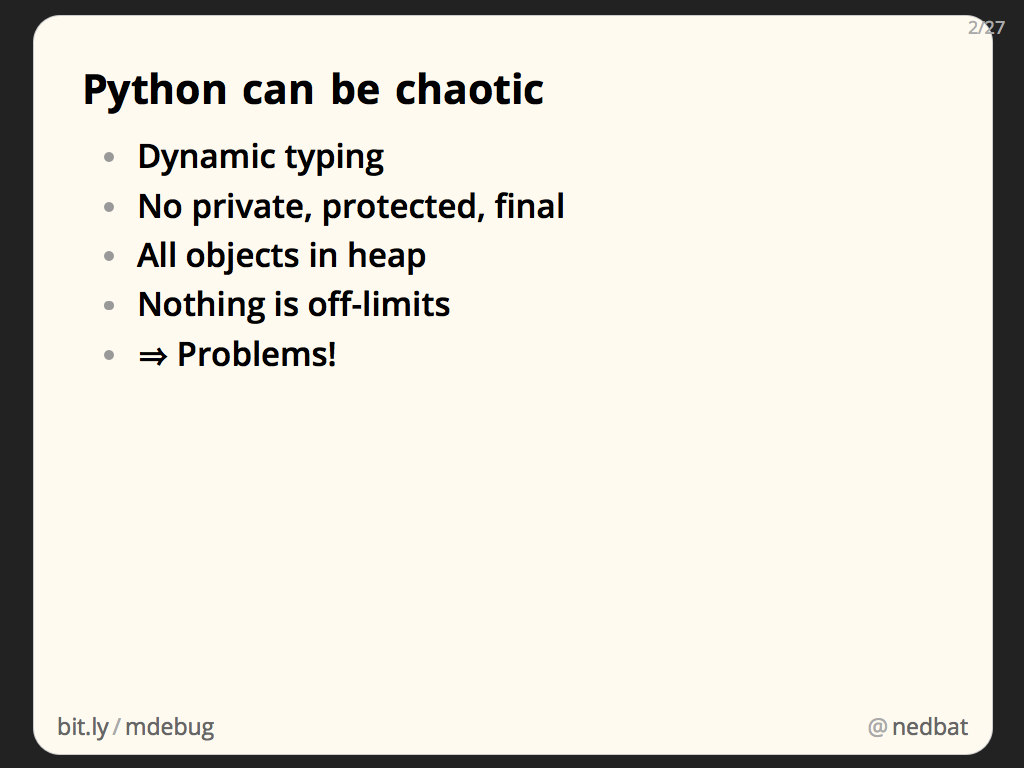
But at heart, Python is simpler and more fluid than other languages. Sometimes you want this fluidity, but usually you don’t. Dynamic typing means that names may have values you don’t expect. Where other languages offer access control over the internals of objects, Python lets you examine and change anything. All of your program’s data is on the heap, and can be used throughout your program.
All of this flexibility can be a powerful tool, but sometimes, things go wrong. The flexibility comes back to bite us, and causes problems that we have to debug.
OK, Python’s lack of rules got us into a mess. Let’s use that freedom and power to figure out what’s going on, so we can solve the problem.
We’ll look at a few real problems that cropped up in real projects. We’ll debug the problem using dirty tricks to get at the information we need. Along the way, we’ll examine how some Python mechanisms work.
These techniques are not for use in real programs! They are temporary hacks to get you out of a tight place. When you are in a jungle, a machete is a very good way to get out, but for real work, you should build real paved roads with signs and painted lines.
Ideally, you’d prevent these bad situations from happening in the first place. I’m mostly not going to talk about how to avoid the problems: there are lots of talks out there that can help you build properly from the start. This talk is about using Python’s flexible power to untangle yourself once you’ve gotten into trouble.
All of the code in this talk is meant to be used, and then discarded. Once it has served its purpose of getting you the information you need to understand the problem, it should be deleted. It is all hacky, and all “wrong” on some level.
By the way, a few of these cases I’ve written up in more detail on my blog. I’ll provide links to those posts as we go.
Case 1: Double importing
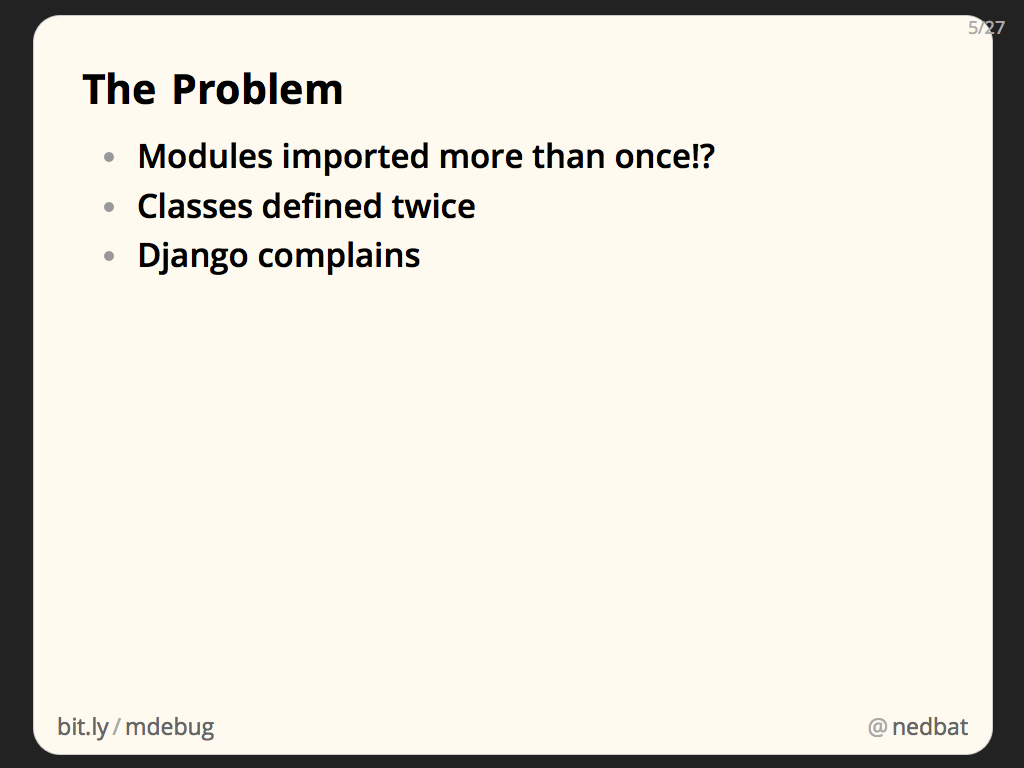
We had a problem where our modules were being imported more than once. Since they contained class definitions, this meant our classes were being defined twice. It’s never been a good idea to live with this situation, but Python won’t complain about it, and often, it doesn’t cause any issues. But recent versions of Django complain about it, which is how we discovered it was happening.
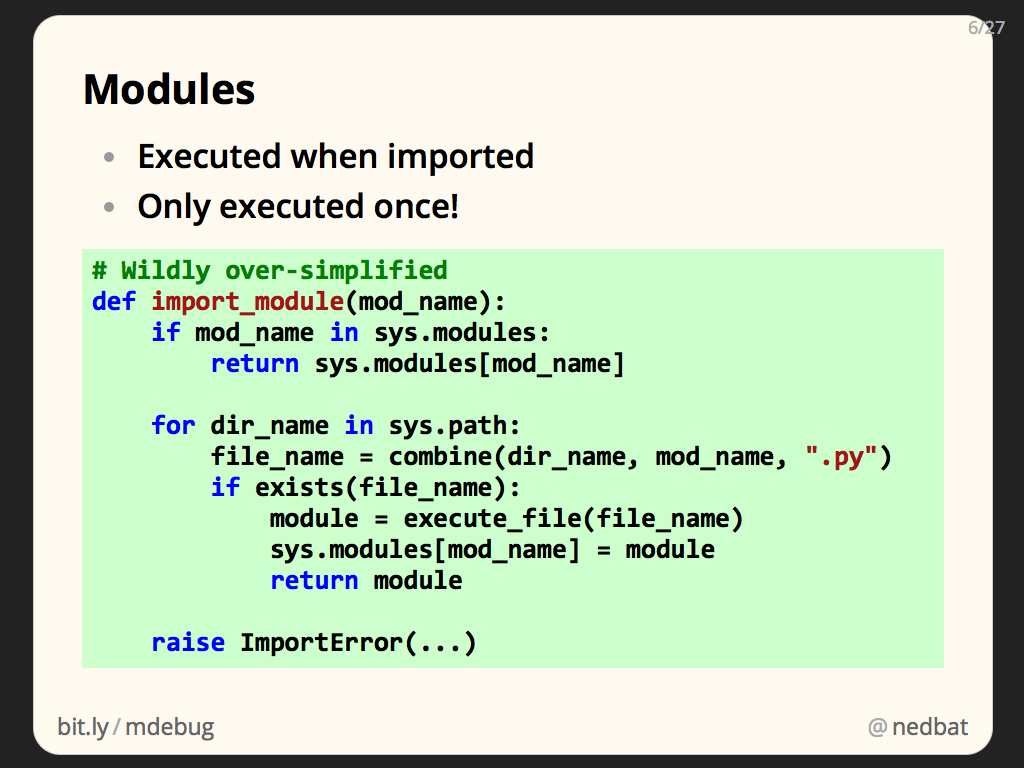
When you import a module, the .py file is found, and executed, and the results become the attributes of the module.
Modules are only executed once, because the sys.modules dictionary keeps track of all the modules that have been imported. Once a module has been imported, subsequent import statements simply find the module in sys.modules, and return it, rather than executing the file again.
The first time a module is imported, Python has to find a .py file for the module. sys.path is a list of directories that Python uses to look for .py files. Each directory is examined for the .py file. When the file is found, it is executed, a module is made from the result, and the module is stored in sys.modules.
With all this machinery to ensure files are only executed and imported once, how are ours being imported twice? We could read the code, or use grep to look for reasons. But one of the consequences of Python’s dynamic nature is that static analysis like that is difficult.
So instead of static analysis, we’ll use dynamic tools. Let’s run the code, and get it to tell us what’s going on. This theme runs through all of the cases we’ll look at: rather than try to analyze the code, we’ll run code to understand it.
To find the problem, we’ll take advantage of the fact that importing a module really executes the code in the module. Classes and functions are defined in a module because the class and def statements in the .py file are executed. Often, it’s easy to think of modules as just containing classes and functions, but they are really executable statements that define classes and functions.
Whatever code you put at the top-level of a module, it will execute when the module is imported. There is no special “just define classes and functions” mode that imports your module. The code is really run, and any statement can be in a module.
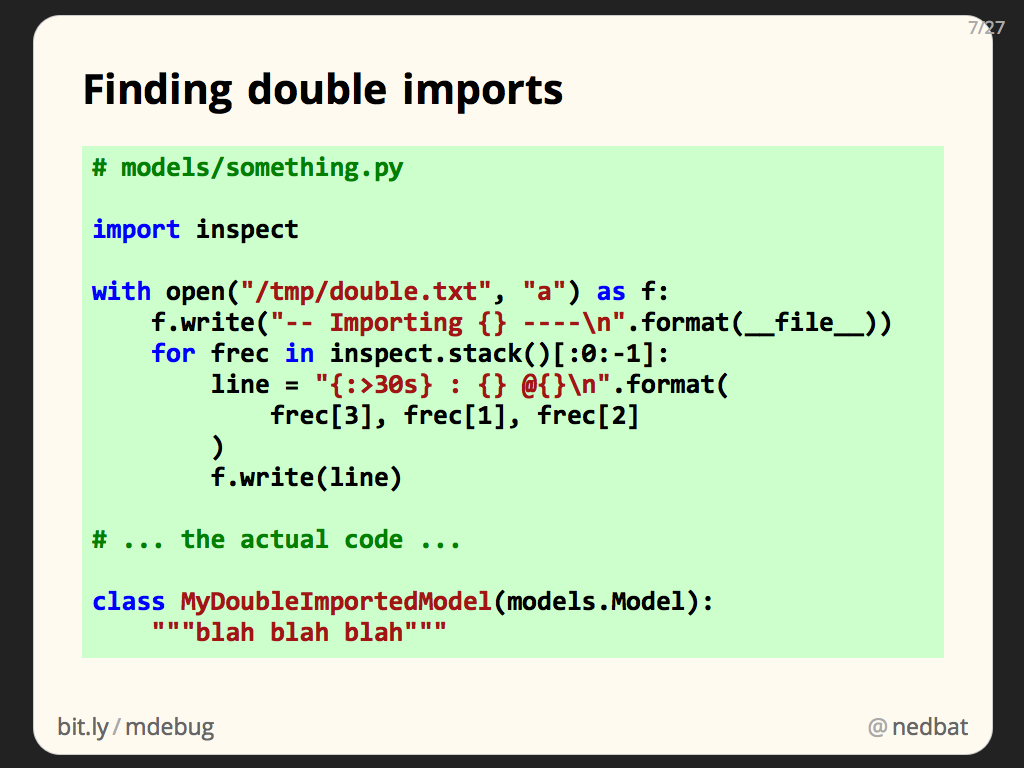
So if we put code into one of our double-imported modules, it will run, twice. The code we put in uses inspect.stack to examine the current state of the call stack. This will tell us who is importing the module.
If you haven’t looked at the inspect module, go take a peek. It has lots of interesting functions for getting information about all kinds of things. inspect.stack returns a list of tuples, one for each frame in the call stack. The tuples include the name of the function, the filename and line number, and a list of source lines around the call site. It’s a great way to pinpoint where you are in your program.
Here I’m formatting the function name, file name, and line number, into one line for compact output.
I’m also opening a temporary file for output, and writing the results to it. I do this so I don’t have to worry about whether stdout is being captured, or where it is going. By opening a specific file, for appending, I can be sure about where my output is going.
This is the “wrong” way to log, but I don’t care. I didn’t want to fiddle with the right ways, and this code is only temporary.
The results look like this. The way I’ve formatted the stack, the function name is to the left of the colon, and the file name and line number are to the right. In this case, the function name isn’t that useful, since what we’re looking for is the file that is importing the doubly-imported module. The import statements won’t be inside a function, so it’s reported as <module> instead.
With these results, we have two files to examine, the last one in each stack trace: second/summary.py and first/admin.py.
Once we looked at those two imports, we could see what was wrong. This slide shows a simplified version of the problem.
In our source tree, we had files that were accessible through two different entries in sys.path. The asterisks show the directories that were in sys.path. The file that was being imported twice was project/thing/apps/first/models.py.
In one file, it was imported as “thing.apps.first.models”, and was found via the “project” sys.path entry. In the other file, it was imported as “first.models” and was found via the “project/thing/apps” sys.path entry. The first import created a “thing.apps.first.models” key in sys.modules. The second import looked for a key of “first.models”, didn’t find it, and then imported the same file again.
The fix was to choose one style of import, and stick with it throughout the code.
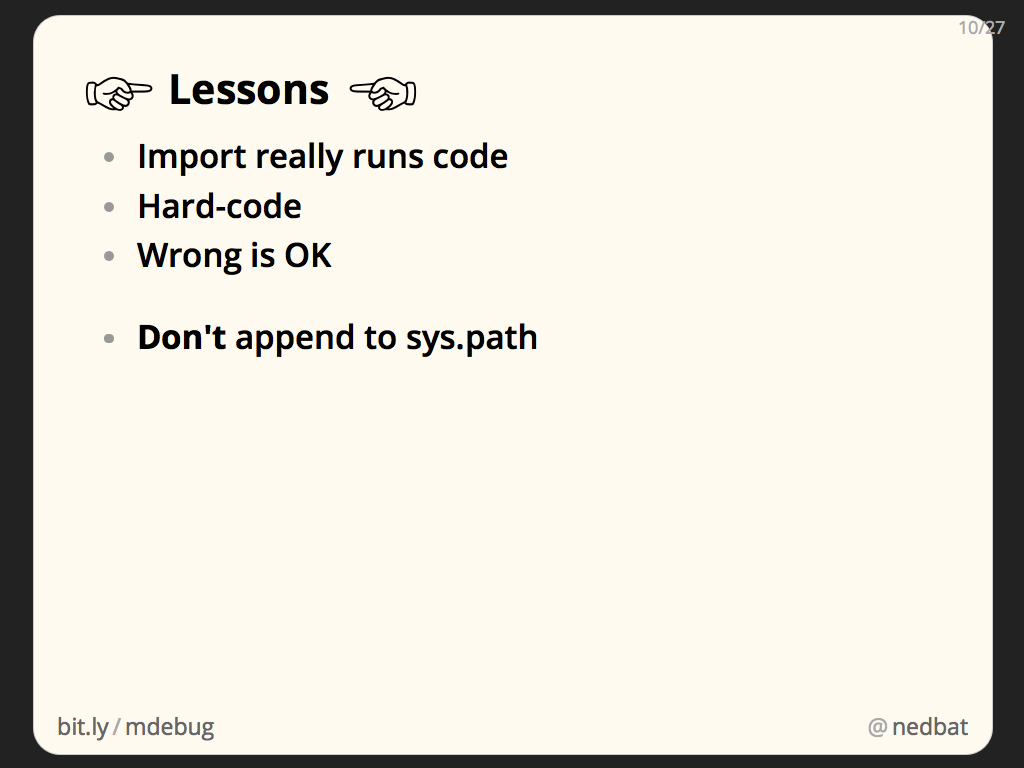
Some things we took advantage of here:
- Importing modules really executes code. Good practice is to avoid code with side-effects that runs at import time, but in our case, it was exactly what we needed.
- Hard-coding details simplifies the hack. We wrote directly to a temp file of our own choosing. We put the code directly into the module in question.
- We can do things as wrong as we like, since the code will be deleted once it’s given us the answers we need anyway.
Case 2: Finding temp file creators
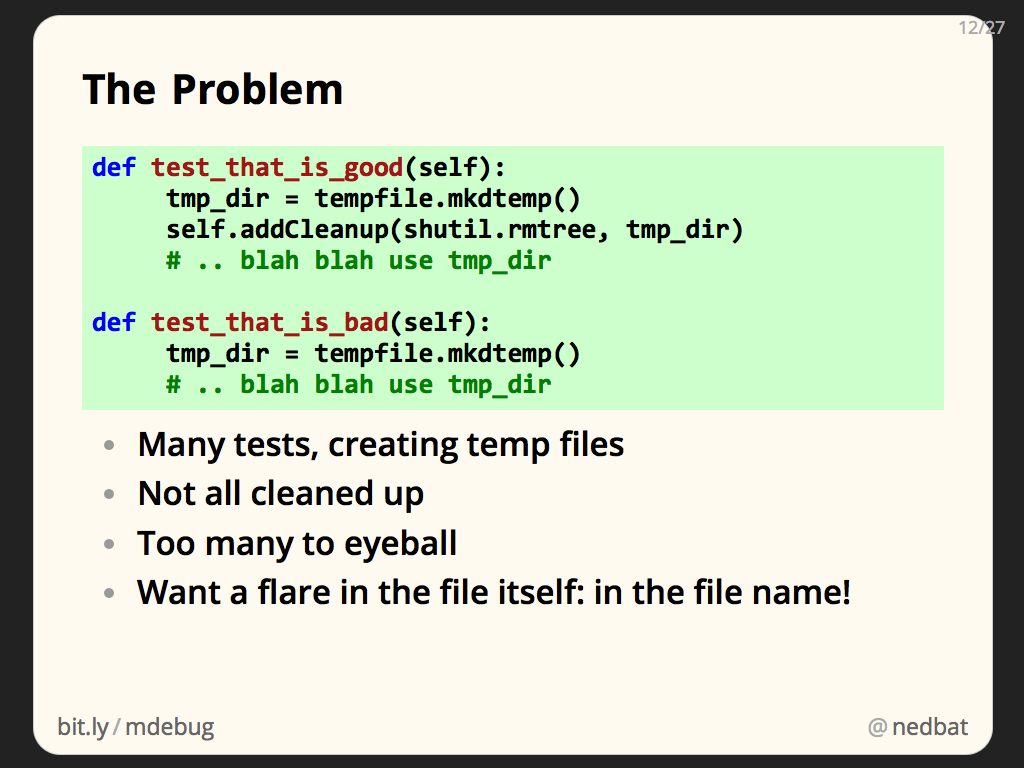
Many of our tests create temporary files or directories. The good tests properly clean them up at the end of the test run. (By the way: if you are using unittest to write your tests, definitely use addCleanup, it’s much better than tearDown.)
The bad tests weren’t cleaning up their temporary files and directories. Finding those tests was difficult, because they weren’t written as simply as the example here. The temporaries were created in helper functions, making it harder to find the places where a temporary was being made but not cleaned up.
We want information about who creates the files. One way would be to note the name of each temporary file created, along with the call stack that made it. Then when the test suite finishes, we could look up the names of the marooned files to see where they came from.
I took a different approach: since we only care about the files that remain when the tests are done, what if we write the information we need into the files themselves? We can’t write our own data into the content of the files, since the content is being used by the tests. But the file names are essentially arbitrary anyway, so we can write information there.
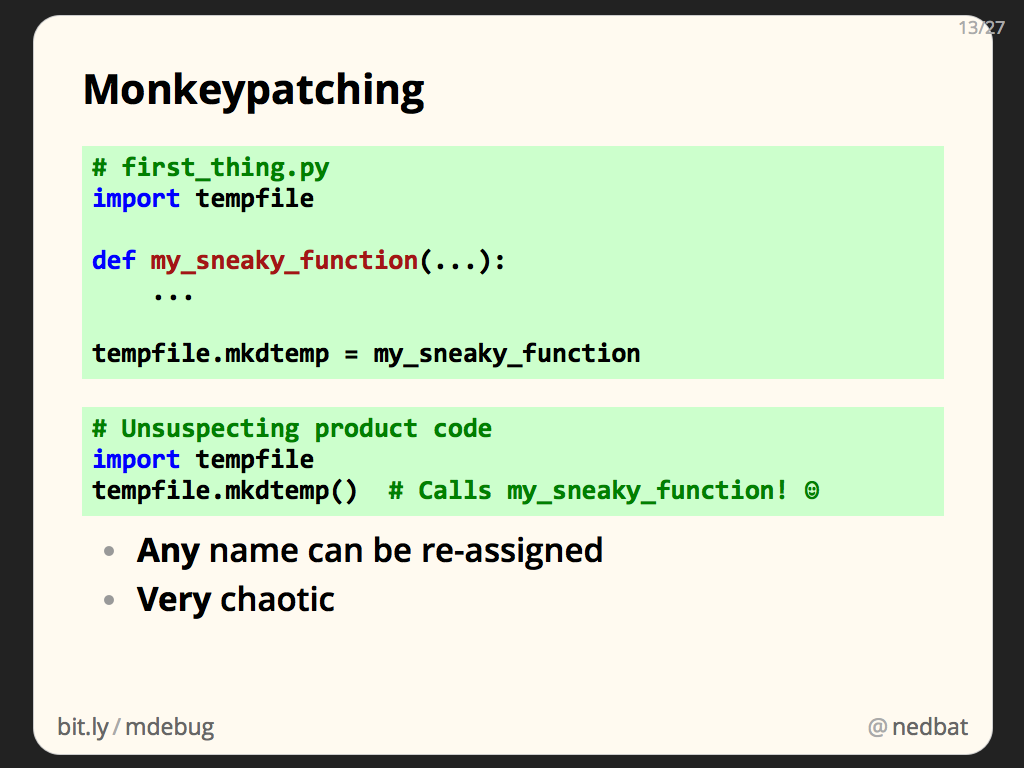
To do anything special during the creation of temporary files, we’ll monkeypatch functions in the tempfile module. Monkeypatching is the colorful name for changing someone else’s code at runtime by injecting your own code into their namespace.
For example, to change how mkdtemp works, we can define our own function with the same calling signature, and then assign it to tempfile.mkdtemp. Now unsuspecting product code that calls tempfile.mkdtemp will actually be running our function, rather than the code in the standard library.
This works because no names are special in Python: mkdtemp is an ordinary attribute of the tempfile module, and can be reassigned just as any other name can be. This may seem odd: the standard library feels like it should be unchanging, the rock on which we build our programs. But the standard library is made of Python modules like your own code is. Any name can be reassigned.
Monkeypatching can be very powerful, since you can hijack any name that other parts of your program are using. It can also be dangerously chaotic.
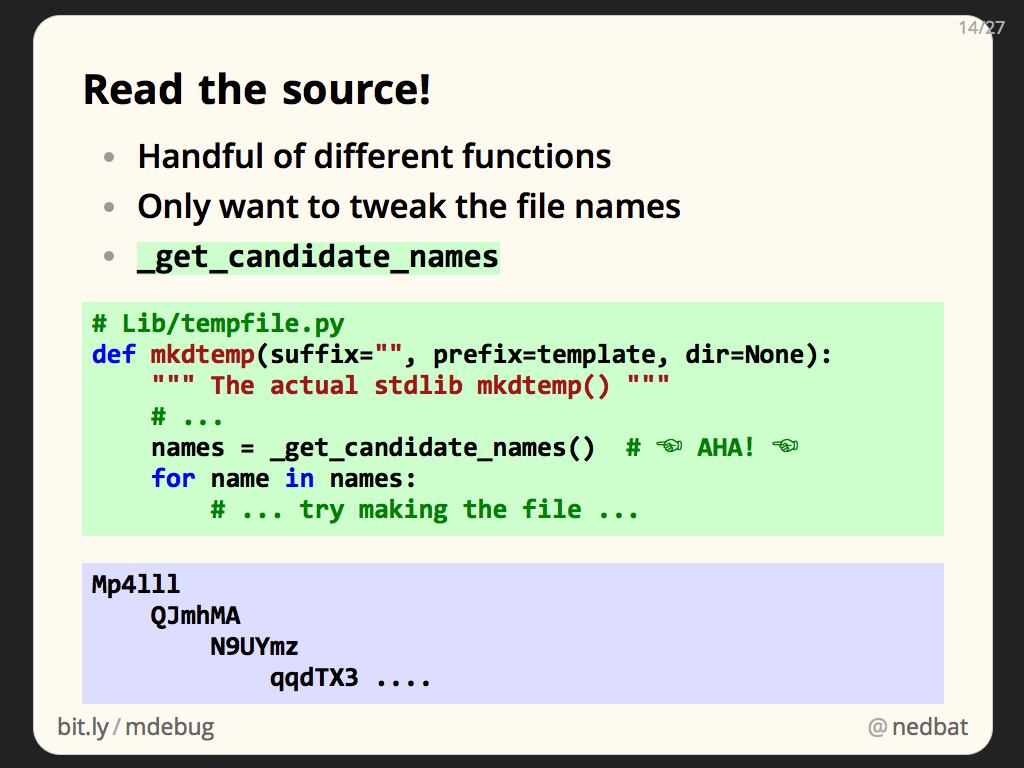
One of the things that can be tricky to get right when monkeypatching is what exactly to patch. In our case, there are a handful of different tempfile functions that could be involved. And we don’t want to take over the entire function, we just want to change what names the files get.
Reading the source in tempfile.py, it turns out that all of the functions that create temporary files or directories make use of the same helper, _get_candidate_names. This function generates a sequence of possible file names. It’s responsible for the typical random names you see in temporary files. The functions then try each name in turn, looking for one that isn’t already being used.
If we monkeypatch _get_candidate_names, we’ll have killed two birds with one stone: we’ll centrally affect all of the functions that can create temporary files, and we’ll only affect the file names they create, not how they create the files, or what details they return.
Another factor that complicates monkeypatching is that you have to patch the function before it gets called. You might also need to patch the function before it is imported, depending on how it’s imported. For the most effective monkeypatch, you want to run your patching code before any other code in the program.
Ideally, we’d have a way to run the monkeypatch before the main program. But Python doesn’t have a feature for running a preamble before the real program. Luckily it has a way we can sneak code into the startup of the interpreter.
One of the ways that installed packages are referenced is by a Python-specific form of symbolic link called a .pth file. These small files usually just contain the name of another directory to include when searching for packages.
But if a line in a .pth file begins with “import”, then the line is executed! We can use this, along with the knowledge that code in imported modules is truly executed, to get code to run as early as possible in the program.
We create a file called first_thing.py, and put in it all the code that we want to run first thing. Then we create a file in the site-packages directory called 000_first.pth. It imports first_thing. We name the file 000_first.pth because .pth files are processed alphabetically. Our name will ensure that our code is run even before other .pth files are processed.
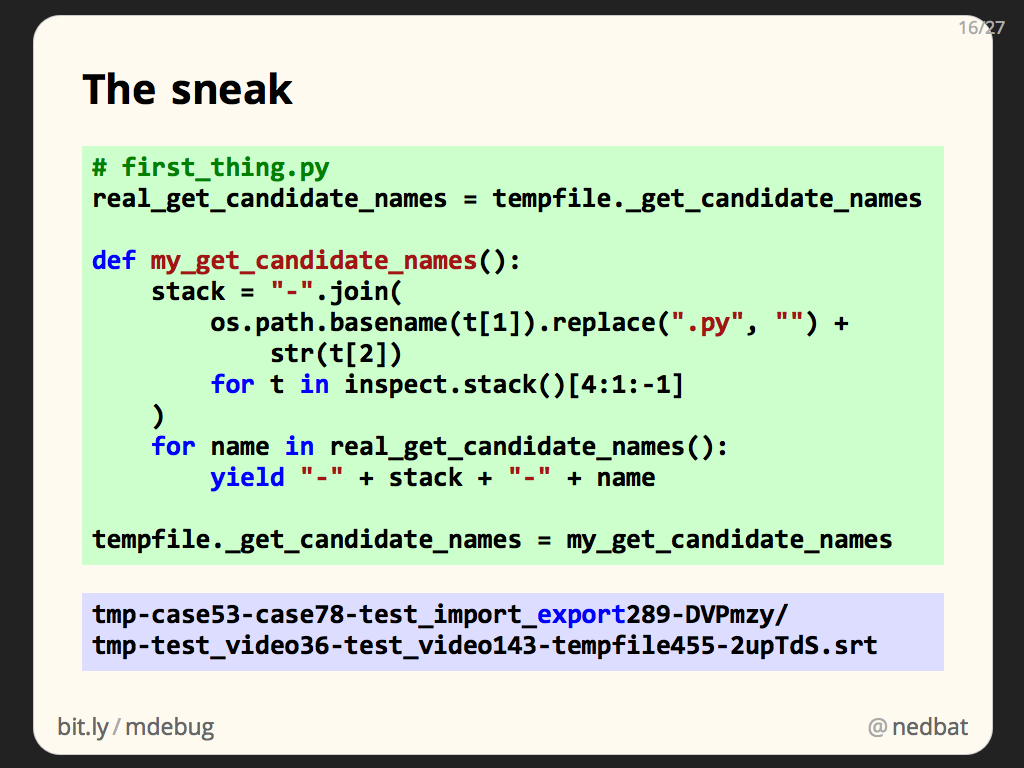
Now that we have a way to run code on startup, here’s the patch itself. We define my_get_candidate_names to yield possible names for the temporary file. We save the original _get_candidate_names function so that we can use it as part of our function. Our function uses our old friend inspect.stack, concatenating the last few source file names and line numbers into something compact enough to fit in a file name.
We monkeypatch tempfile._get_candidate_names, and now any tempfile function that makes temporary files will have our stack traces in their file names.
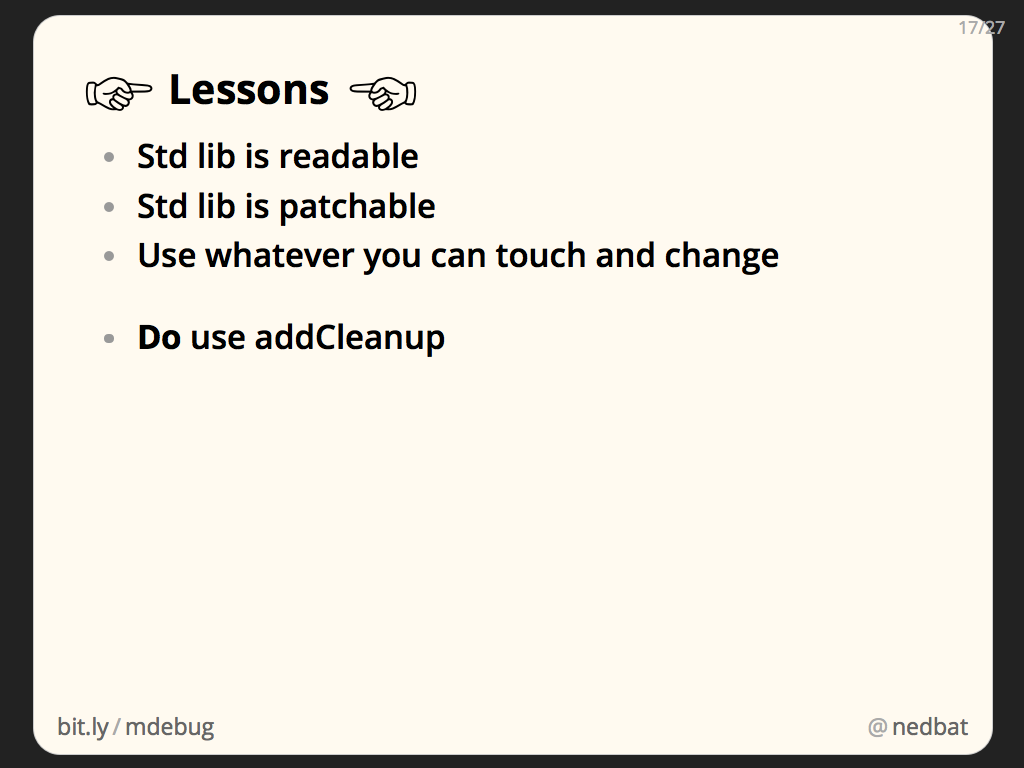
Lessons:
- You can read the standard library. This simple fact is sometimes overlooked. Even before we get to monkeypatching, just being able to read the standard library code is a powerful way to be able to understand what is happening in your program.
- You can patch the standard library. It’s mostly just Python code like anything else. You can change how it works to get some leverage over a thorny problem. Don’t do it for real code, but for emergencies, it can be very helpful.
- .pth files are normally a small invisible part of your Python installation, but we can use them to inject code at startup time.
- Here we used a clever trick of writing information into the names of temporary files. Often when debugging large systems, there are parts that are not as accessible as you’d like. Think creatively about the information you need, where it is, and where you can put it so that you can see it well.
More detail on this case is in my blog post Finding Temp File Creators.
Case 3: Who is changing sys.path?
At one point, our test suite was failing because the wrong module was being imported. We had “import xblock”, intending to find “apps/xblock.py”, but we were importing “lib/xblock.py” instead. But “lib” wasn’t on the path, so how was it being imported?
Examining sys.path where the import was happening (by just adding a print statement before the import!), there was a new incorrect entry that had been added to sys.path. What put it there?
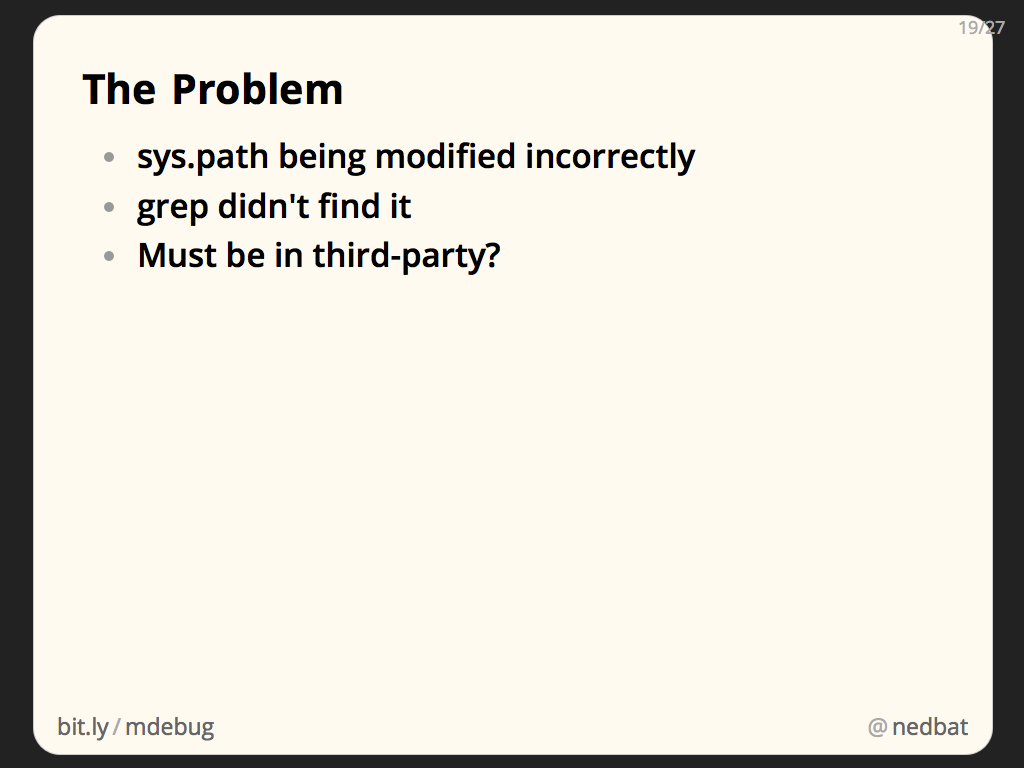
We already knew we had sys.path manipulation that we were not proud of, so maybe there were others to find. A check of our sources proved that we weren’t doing it. Some third-party code must be at fault. We couldn’t grep all of the third-party modules we were using. How to find the culprit?
What would be great is a way to break into the debugger when a certain piece of data is changed. In this case, the incorrect entry in sys.path was being added as the first element, and it ended with “/lib”. We want to stop in the debugger when a condition is true: sys.path[0].endswith(“/lib”).
The standard Python debugger, pdb, doesn’t have this feature. You can set a breakpoint at a particular line, with a condition. But we wanted a condition untethered from a line of source code. We wanted to stop in the debugger when the condition became true, no matter what line of code was running.
Python debuggers (and other tools, like coverage measurement) are built on a feature called the “trace function.” This is a Python function that is called for every line of running program. Every time a new line is executed, the trace function is called to track the program’s progress.
Since our condition is so simple, it’s easy to write a trace function to do what we want: check the condition, and if it’s true, break into the debugger:
def trace(frame, event, arg):
    if sys.path[0].endswith("/lib"):
        pdb.set_trace()
    return trace

sys.settrace(trace)
To be honest, I wasn’t sure what would happen if I tried to start the debugger from inside a trace function. That seemed particularly twisty, but this trace function was simple enough to write and try, I figured I’d give it a shot. This is classic machete-mode style: there was a good chance this wouldn’t work at all, but it was easy to try.
It worked great: with this trace function in place, the test suite ran (really slowly!), and revealed that our test runner, nose, was adding the entry to sys.path. A little more investigation revealed that this was configurable, so it was easy for us to disable.
Lessons:
- Problems might not be in your code. Everything is running together in one process. Python doesn’t provide access control in classes, so code can be misbehaving from surprising places.
- Dynamic analysis is very powerful. Rather than use static analysis (like grep, though it feels funny to bestow such a fancy term on good old grep), coming at it from a dynamic point of view found us the answer more quickly. You want to know who is changing data? Watch the data.
- Python has some big hammers: a trace function can not only observe your entire program running line-by-line, it can modify values, and even change what line will run next. It underpins every debugger, so whatever debuggers can do, it can do.
More detail on this case is in my blog post Ad-hoc Data Breakpoints.
Case 4: Why is random() different?
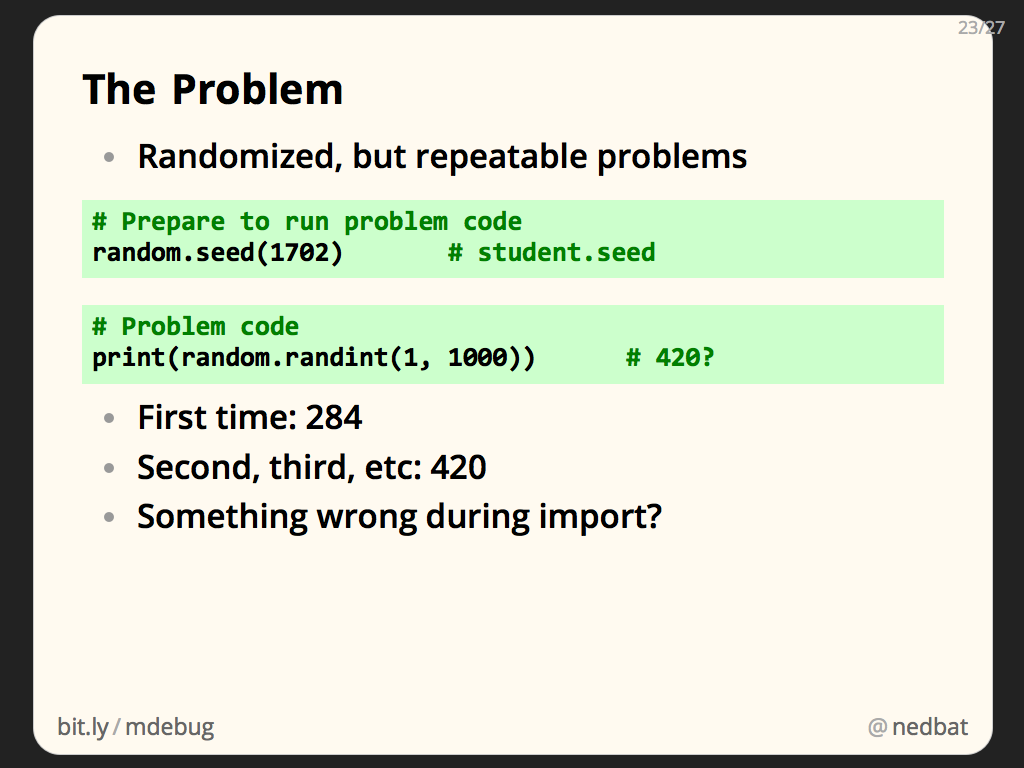
We run Python code as part of presenting problems to students. We randomize some components of the question so that different students get different problems. But we seed the random number generator with a student-specific seed so that if a student revisits a problem, they will see the same problem each time.
We were seeing that the first time the problem generation ran, it would get one set of values, but then subsequent runs would get different, but consistent values.
The “first is different than the rest” factor made me think that something was happening during import. Remember that modules are executed when they are first imported, but subsequent imports just use the stored module object.
There were two ways the random sequence could be changing: either something was re-seeding the random number generator, or something was eating some random numbers from the sequence.
A little experimentation in the interactive interpreter showed that one value was being consumed from the sequence. But where?
Again, we’ll use monkeypatching to find the problem. This time though, instead of providing a useful new implementation of the function, we’re planting a booby trap.
We replace random.random with a function that will raise an exception when called. Then we can run the code, and examine the traceback to see what is consuming the random number.
The code is very simple: 1/0. Dividing one by zero will raise a ZeroDivisionError. This is extremely handy. It’s easy to drop into some code when you want to see if it executes. The ZeroDivisionError it raises is an unlikely exception, so you can be sure it’s yours.
Here we run the code again, and our one-over-zero finds the problem quickly. One of our third-party libraries was importing its test-case code. The constructor had a default argument with a random value. Default values are evaluated once, when the function is defined. So this random.random() call happened during import.
This library shouldn’t be doing this, but as an extra bonus, that default value is never used, because the constructor was always called with an explicit value for that argument.
Lessons:
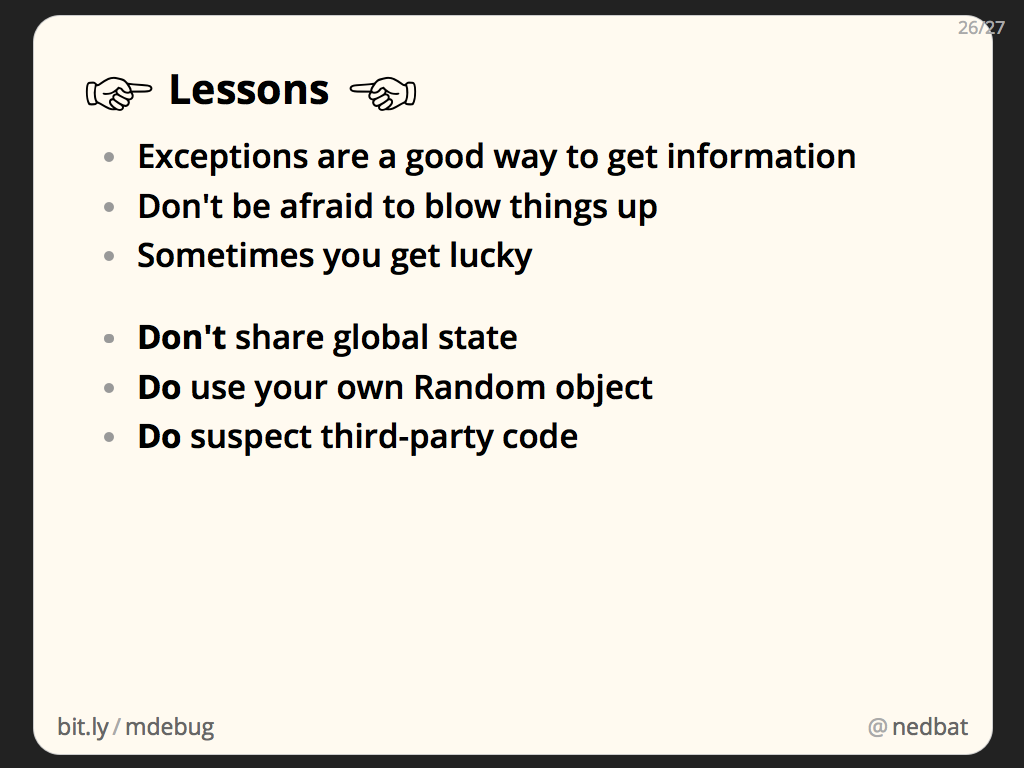
- Exceptions can be a good way to get information from deep inside your program. Another trick: raise an exception with data in its message.
- Don’t be afraid to blow things up: in this case, the monkeypatch destroys the program, but it gives us useful information.
- Some of these techniques require a bit of luck: if the offending call to random() wasn’t the first one, we wouldn’t have found it, because our booby trap stops the program on the first call.
- Avoid mutating globals. One of the causes of this problem was that our code, and the third-party code, were using a single global random number sequence. We were sharing global mutable state. The best solution to this problem was to create our own private Random instance, and use that. Then we could be sure that we were getting numbers from the sequence we seeded.
- A common mistake when debugging programs is to assume that something else is at fault: the compiler, the helper libraries, anything. Usually, this is wrong: it’s usually your own code that is to blame. But sometimes, it really is someone else’s fault.
More detail on this case is in my blog post Hunting A Random Bug.
When your program is misbehaving, you need to get information about what is happening. You can do things wrong temporarily to get what you need, and then clean it up afterwards.
All of the techniques here have been dynamic analysis: getting information from actually running the code. This cuts through all of the dynamism that is hard to analyze statically.
Understanding how Python works gives you leverage against problems like this, and can help you find techniques to solve them.
By the way, if you have liked these cases, you might also like my blog post about Stack Ninjas, which uses similarly subversive techniques.
Thanks for your attention, I hope this has been helpful.













Comments
Although it might have made this talk almost "all monkey-patch, all the time", would it have worked to monkey-patch sys.path with an object of a class that does that value check on every mutation?
Seems to me that would take a bit (maybe a lot?) more code, but it would be a lot faster at runtime. I guess it depends on how long it would take to run your tests if 'nose' wasn't imported early in the process...
@Paul: I don't have a reason to prefer inspect over traceback (any more than the stdlib has a reason to have the same functionality in both places!) I think of inspect first because it offers what I need in the way I need it, without extra functions, and it offers a broader array of functions offering useful information.
Add a comment: